SamKnows FaultFinder
Automatically find network performance faults that would be nearly impossible for a human analyst to detect
FaultFinder
FaultFinder monitors network performance from the perspective of the end user. It builds a dynamic model of normal performance, constantly learning and re-learning to adapt to trend shifts. It compares real-time measurements against these models. When an anomaly is detected it can trace the root cause and also measure the impact of the fault in terms of performance and the volume of customers affected.
Dynamic thresholds
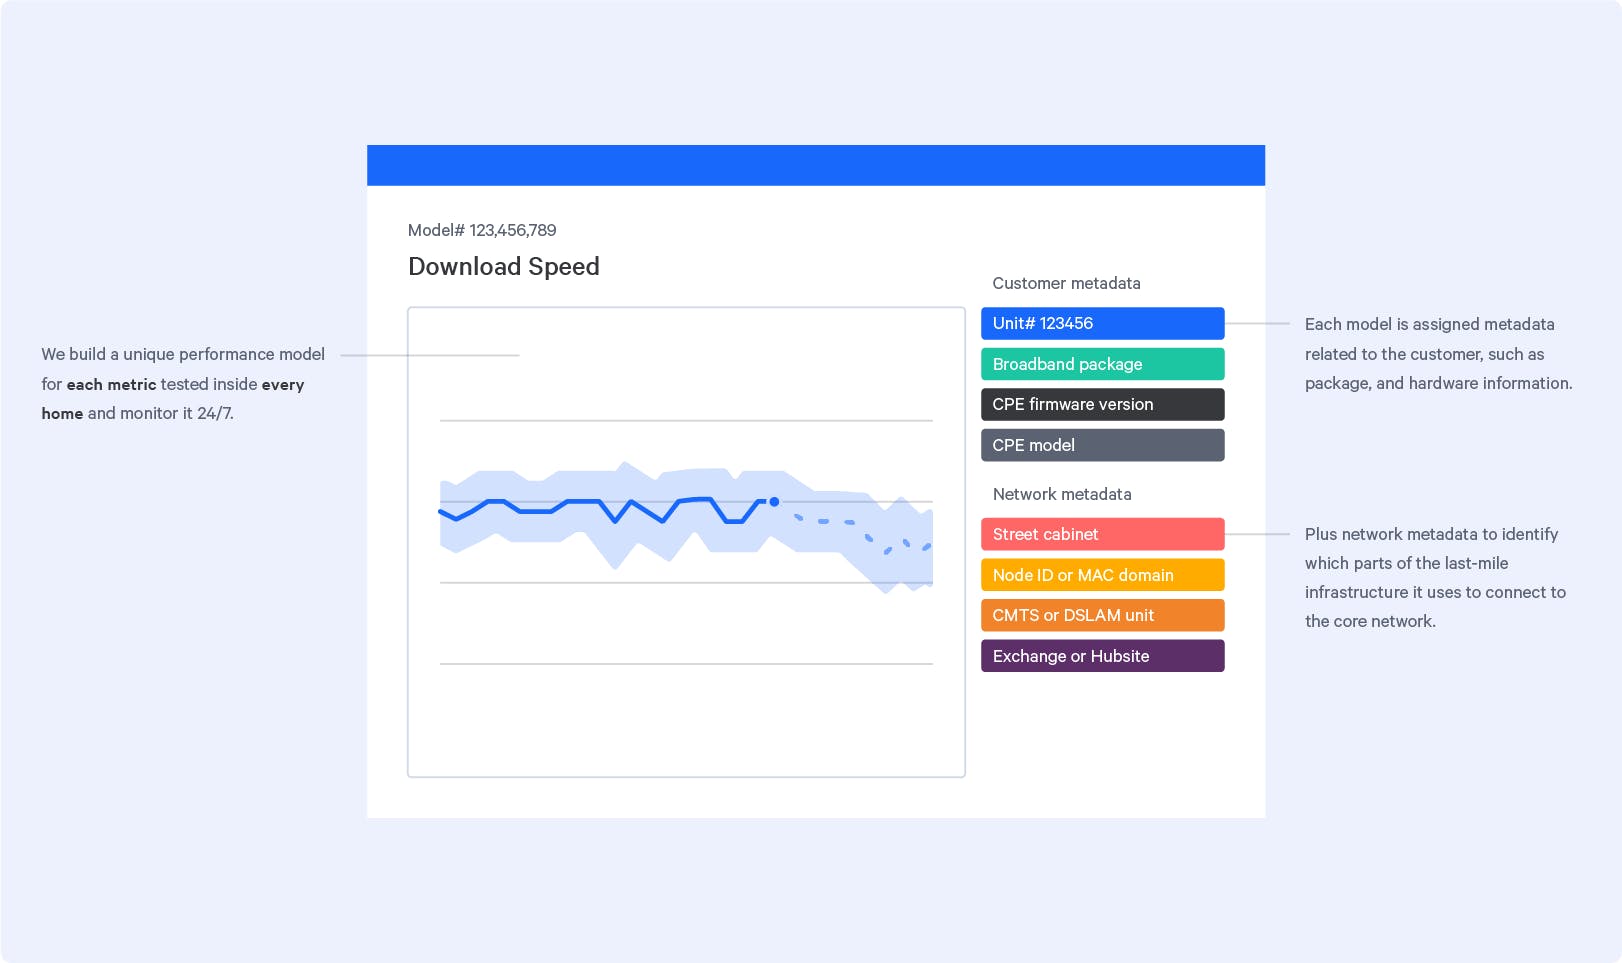
FaultFinder automatically learns normal performance and builds a dynamic model which is constantly re-learning to adapt to trend shifts.
Anomaly detection
FaultFinder monitors a live stream of your performance data 24/7 automatically detecting when things aren’t behaving as expected.
Root cause analysis
FaultFinder's algorithms understand the semantics of cascading problems and pinpoints root cause in one single notification, rather than triggering a tsunami of alerts.
The blue line indicates ‘normal’ performance, based on previous observations. The light blue threshold area that the blue line is within indicates the normal trend range, meaning if anything that falls outside of that norm, FaultFinder recognizes it - shown in a pink line straying from the threshold.
Finding faults that impact customer experience
The quality of your customers’ internet experience relies upon literally billions of interconnections that make up the incredibly diverse and wonderfully complicated internet. ISPs often have excellent visibility of the health of individual bits of equipment within their own network, but it is the interplay of all of these components working together that forms user experience.
These are some of the kinds of anomalies FaultFinder can identify:
Sample size
If the sample size goes down, that means the tests can’t even run or reach the agents, which means there is a problem
Success rate
The tests run but a certain percentage report back as failed
Measurement
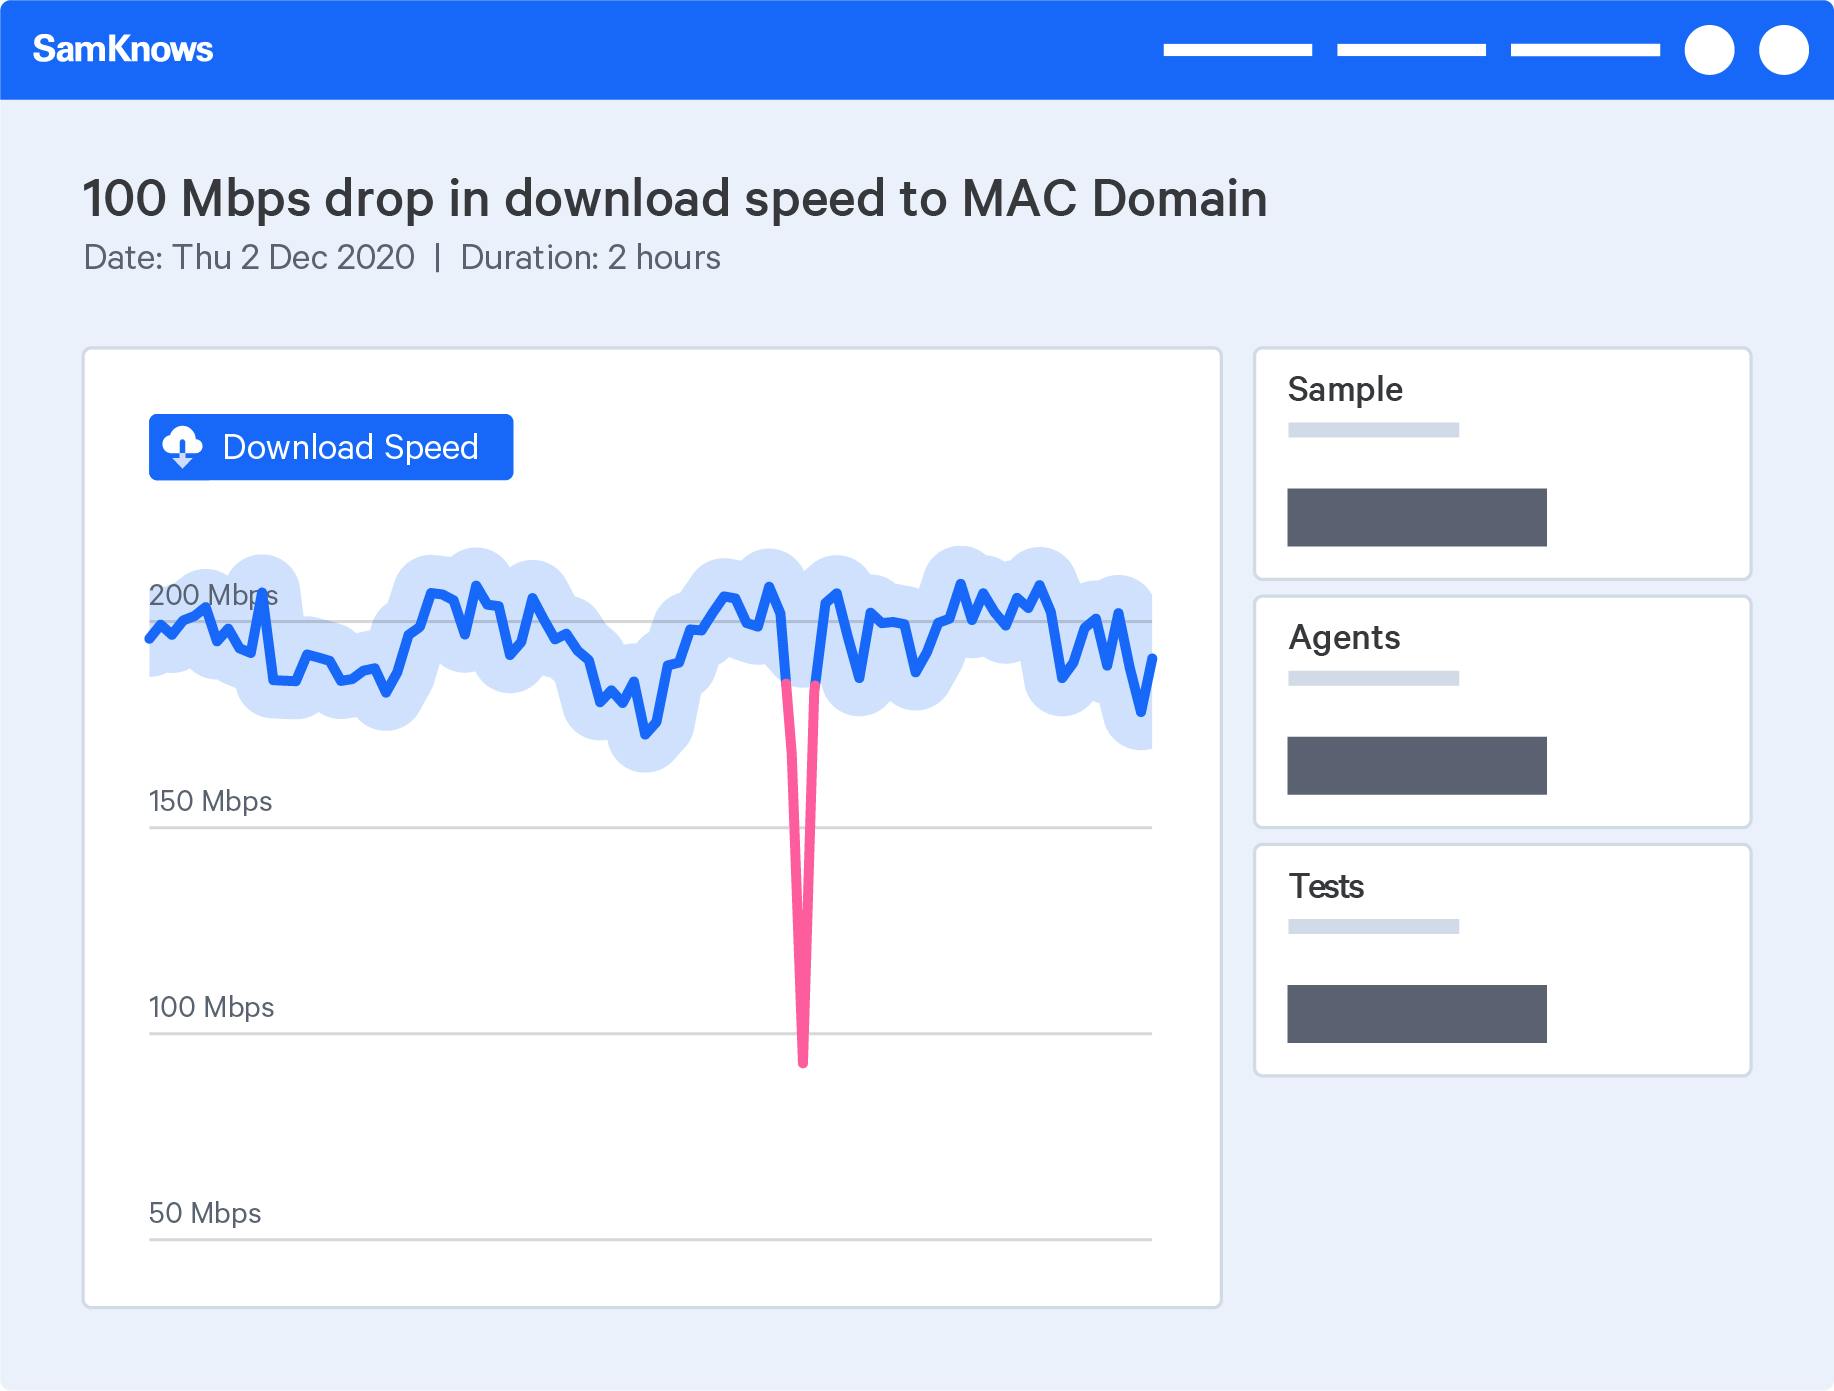
The value or speed we’ve measured. If download speed goes down from say 200 Mbps to 10 Mbps, it may be due to congestion. The tests still run and succeed but the rate or value measured is much different.

FaultFinder builds a dynamic model of normal performance for thousands of different scenarios, constantly learning and re-learning to adapt to trend shifts. It compares real-time measurements against these models.
Drop in performance relating to peering load
When investigated further in SamKnows One, this drop in download speed was caused by an ISP peering issue between around 9am and 11am.

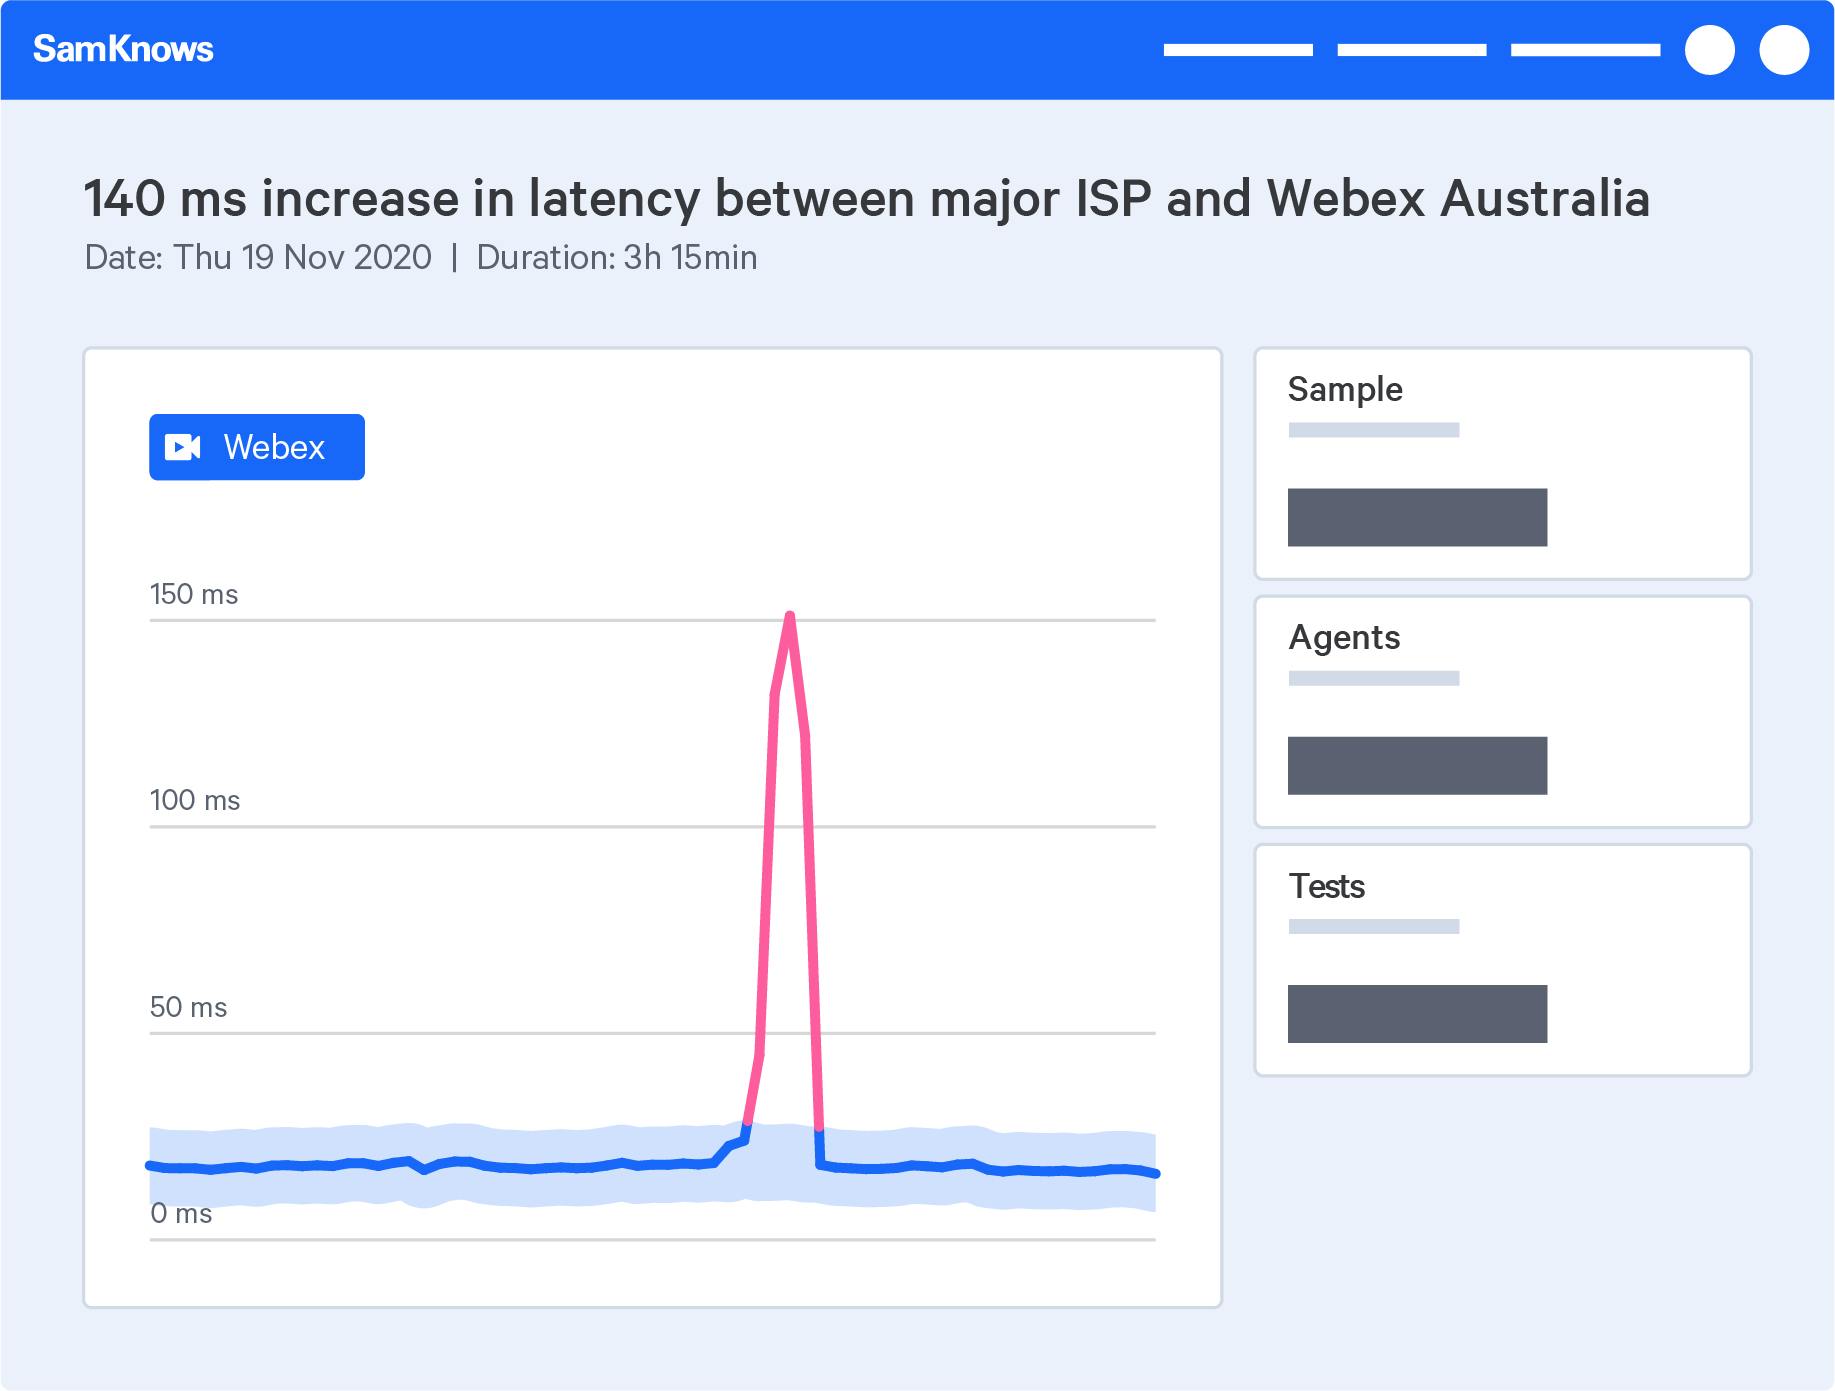
Degraded WebEx service
This anomaly was triggered by a huge increase in latency between a major Australian ISP and the Webex Australia server.

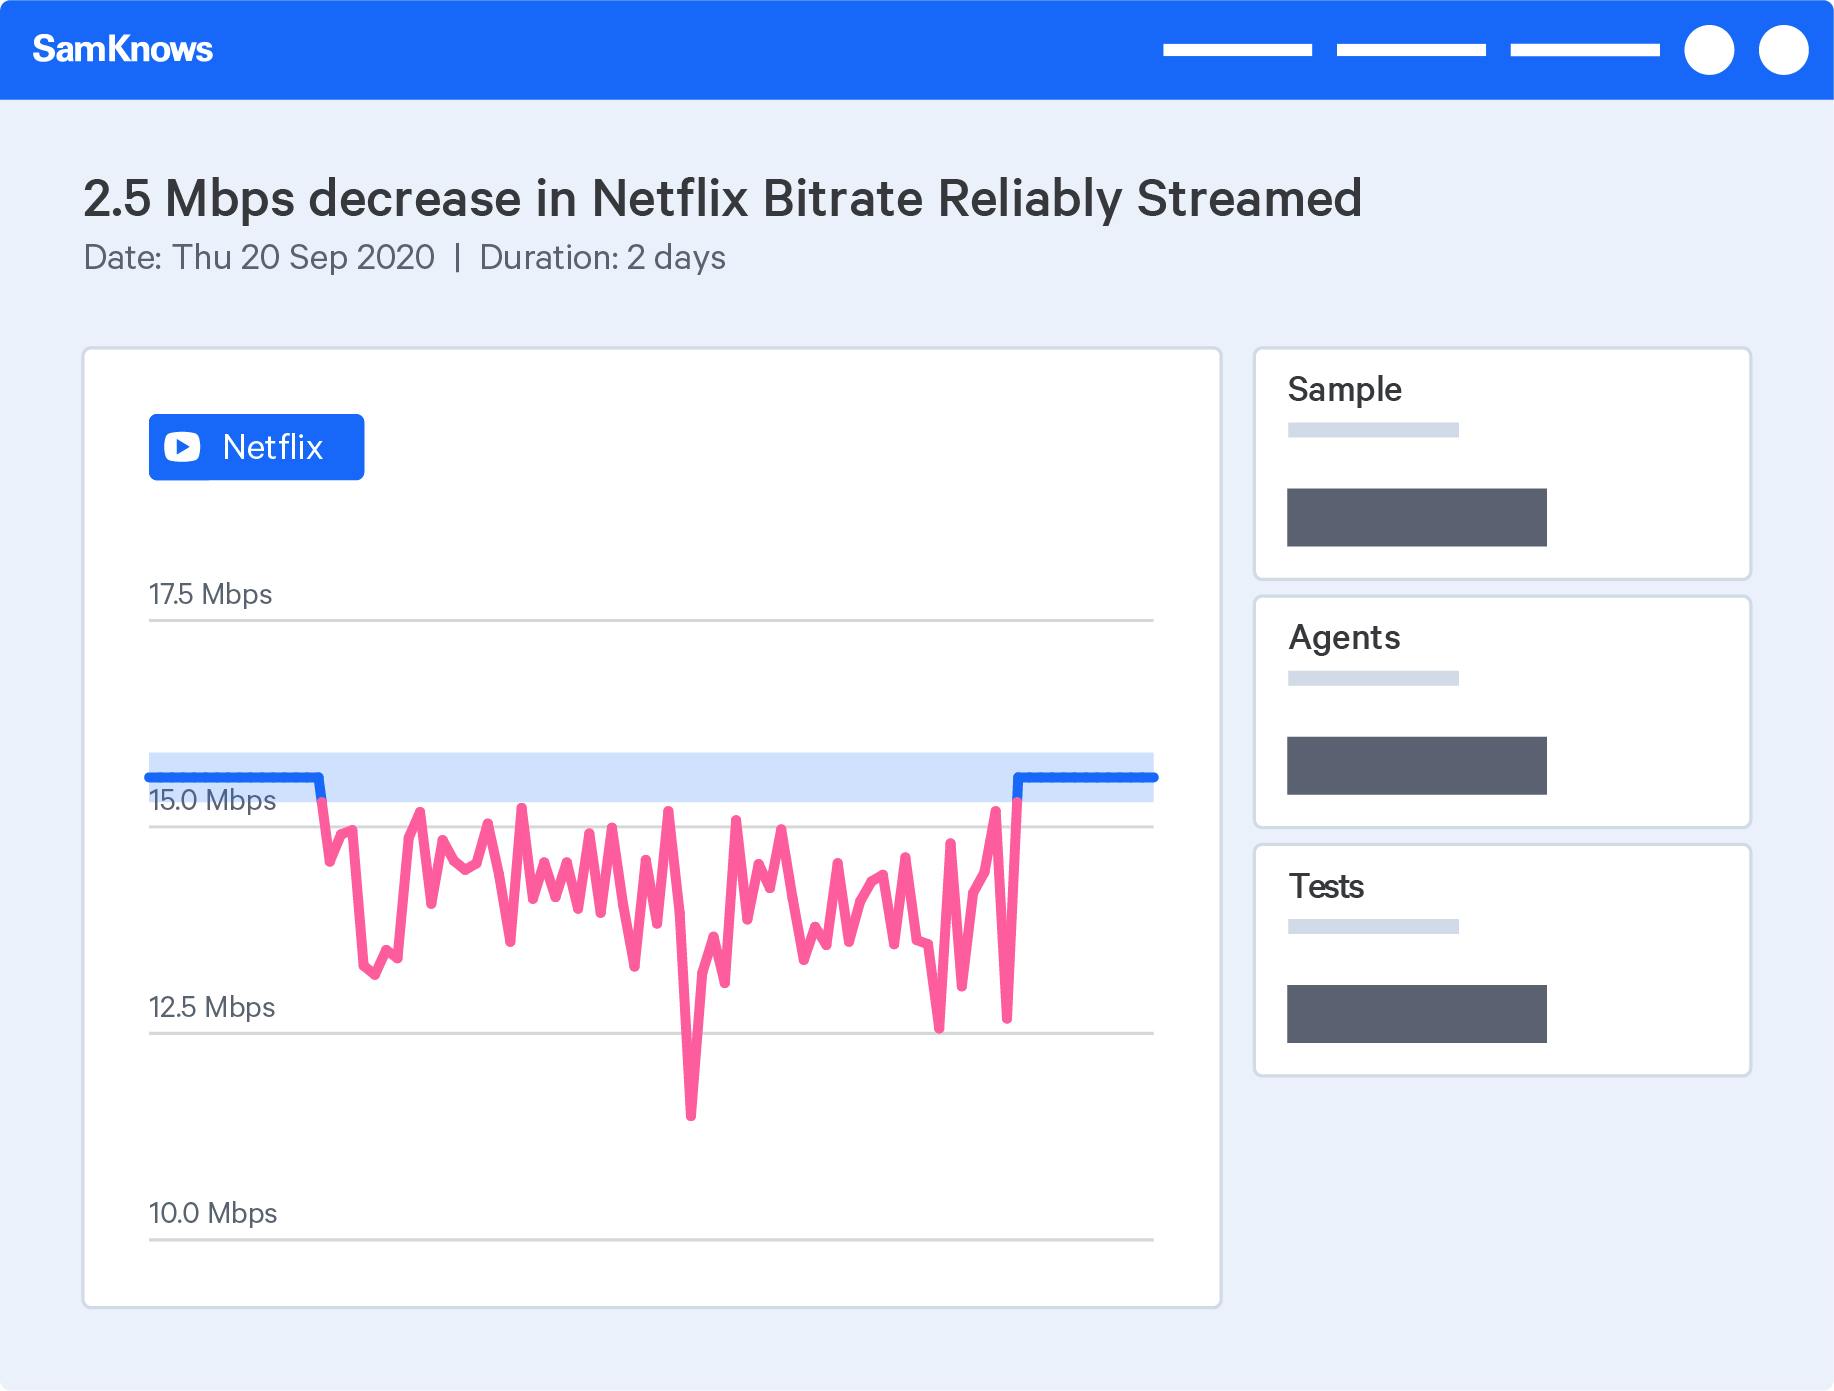
Downgraded Netflix streaming caused by local routing error
This anomaly was caused by a handful of users on a specific exchange experiencing extremely slow speeds to Netflix.

Enhance FaultFinder with network metadata
The more information you give FaultFinder, the better it gets. By adding network metadata to your test agents - things like the telephone exchange, the unit uses, or the CMTS unit inside the exchange - all of these provide more context to accurately trace the root of the cause and its effects.
The ingestion of metadata enables FaultFinder to create normal behaviour patterns for each distinct part of the network. Once these normal patterns have been learned, any anomalies are identified in realtime. At its highest level with no metadata FaultFinder could detect network outages. At its lowest level it can detect issues with a router firmware upgrade in a particular neighbourhood.

By adding network metadata to your test agents provides more context to accurately trace the root of the cause and its effects.
Tests and metrics FaultFinder can monitor
This is where we already excel and because of our extremely active R&D team we are constantly adding new tests. We believe that above a certain speed, speed itself because less important and customers are more interested in consistency and application performance. We are about to deploy the ultimate solution for monitoring the uptime of home connections and that will be available in Connected Home very soon. Our large suite of application tests measure everything from Netflix performance to Google Meet. Everything your customers actually need to use in today’s world.
Download speed
Upload speed
Latency
Packet loss
Jitter
DNS resolution
Voice over IP
Fortnite
League of Legends
FIFA
DOTA 2
Apex Legends
Tom Clancy's Rainbow Six Siege
Among Us
Overwatch
PlayerUnknown's Battlegrounds
Roblox
Rocket League
Valorant
Warcraft
Starcraft
Hearthstone
Heroes of the Storm
Diablo 3
Counter-strike global offensive
Xbox Live
Playstation Network
Steam
Facebook Messenger


Instargram Messenger
Snapchat
Zoom
Skype
Microsoft Teams
Google Meet
GoToMeeting
Cisco Webex
Microsoft Azure

Akamai
Apple
Cloudflare
Amazon Web Services


