SamKnows Continuity
Continuity is designed for the analysis and administration of large-scale studies monitoring internet performance to multiple homes.
Dashboards
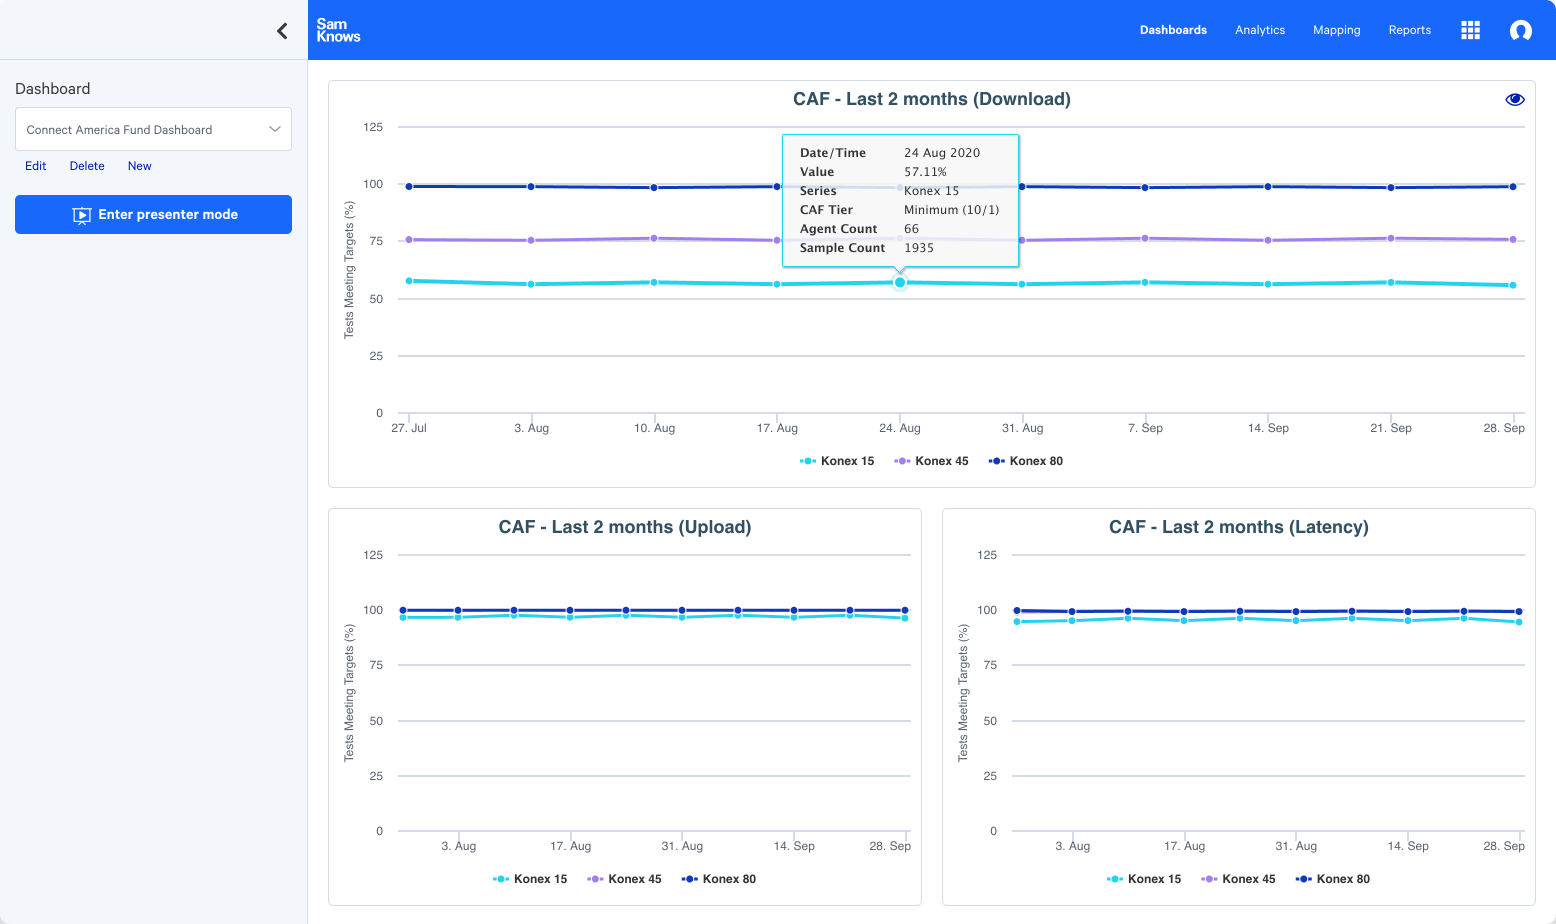
SamKnows One dashboard gives you a view of the key metrics that you care about most. The dashboard uses a grid system that allows you to organise your saved charts into a layout that suits you. Drag and drop charts into the grid area, and resize them as you wish. You may also view the dashboard in presenter mode (full screen), making the dashboard ideal for display in a network operations centre.
View on a big screen
Maximum impact with presentation mode and automatic refresh.
Quick and easy
Quickly build dashboards from existing presets. Customisable your dashboard layout with drag and drop.
Shareable
Easily share dashboards within your organisation

Use your saved chart presets to create a MultiView dashboard with up to 10 charts.
Analytics
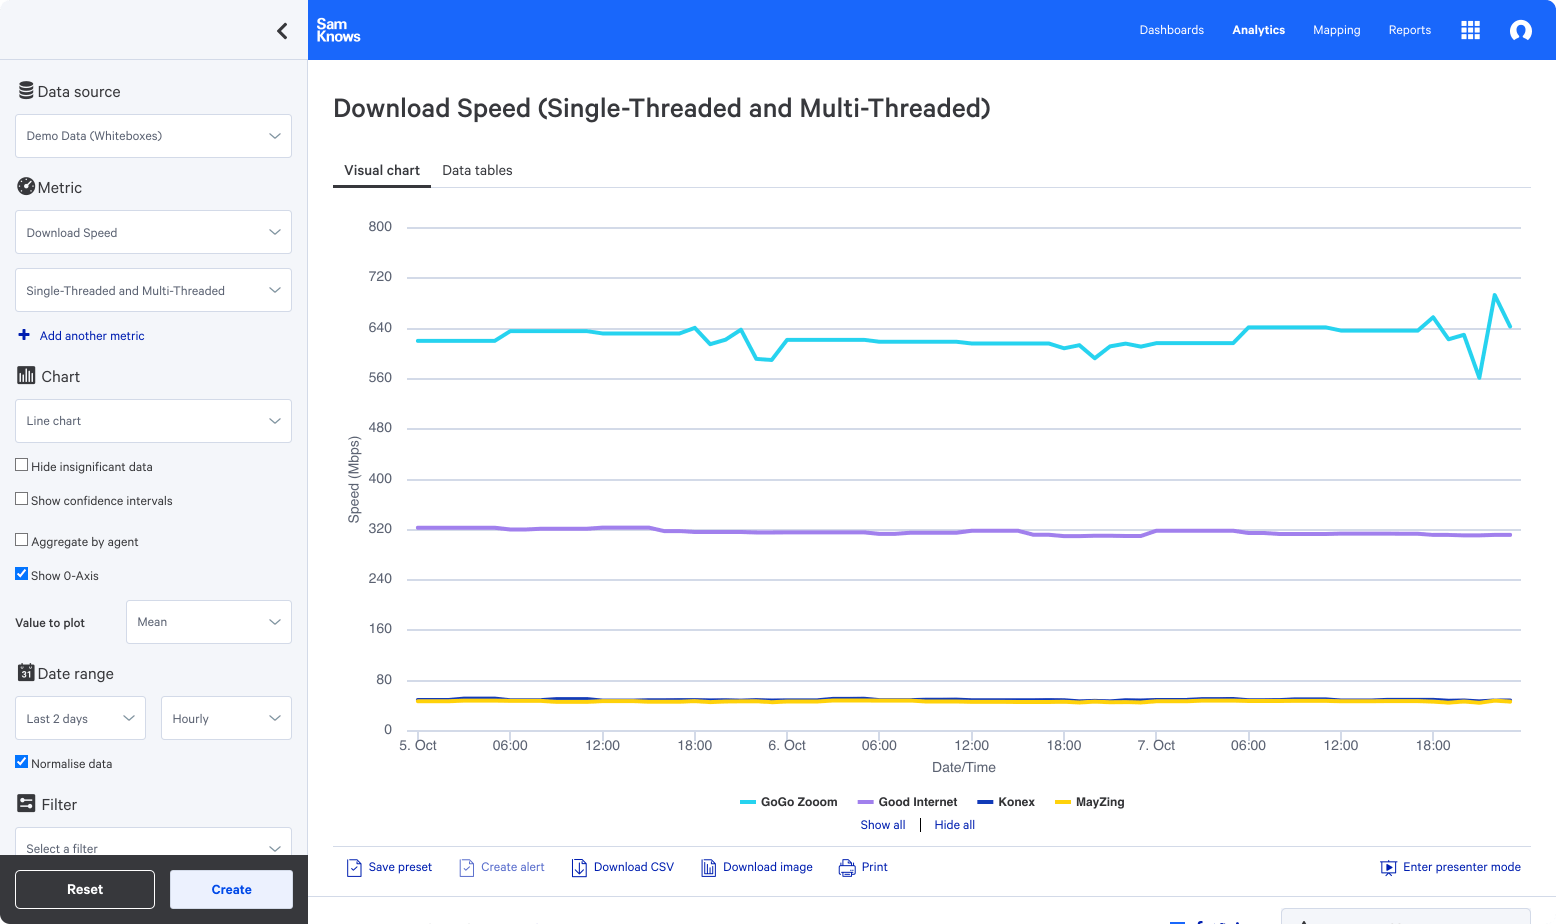
Data analysis is at the core of what SamKnows One does. Our analytics products allow users to analyse all of the collected measurement data in near real-time. Chart metrics in ways that make the data useful and easy to spot changes and make comparisons; before presenting or sharing that data within your organisation.
Visualise
Choose from a selection of different chart types to help you frame your data in the best way.
Split and filter
Filter data by your custom metadata. Split your data for side by side comparisons, it effectively creates a new data series on the chart.
Create presets
Saved chart presets for yourself, or share with people in your organisation.
Multiple datasets
Visualise multiple data series on a single chart. Create a new series from scratch or clone an existing chart.

Line charts aggregate data and plot one or more data series as lines on a graph. Time is plotted along the x-axis, and the metric value is plotted along the y-axis.
Mapping
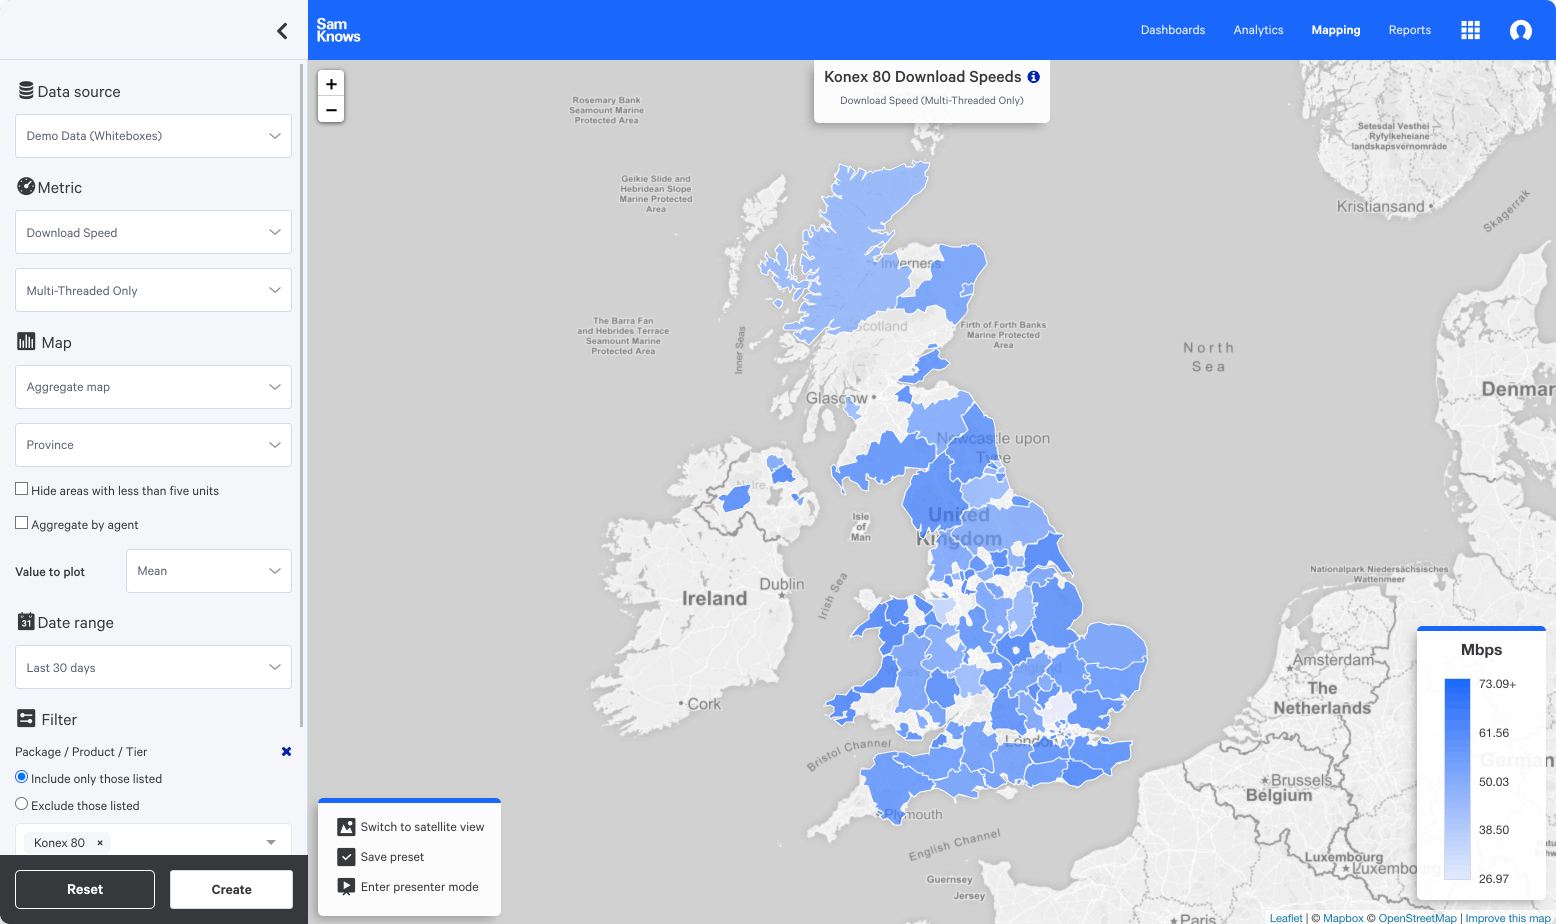
With Mapping, you can visualise your performance data across geographic areas. Identify trends according to location, know exactly where the most tests are run, and provide telling graphics when compiling reports.
Choose map type
View your data on standard map or a satellite view.
Colour-coded data
Plot raw data on a map. Automatically colour-coded to show relative performance.
Nationwide analysis
Visualise aggregated data at a country or regional level. Easily spot variations in performance according to colour.
Hot maps
Generate heat maps, the “hotter” the colour, the greater number of tests were run in that area.

Visualise and aggregate your data generated anywhere in the world, at a country or regional level i.e. province or state. Easily spot variations in performance according to colour.
Reporting
Reports in SamKnows One allow you to save a series of related charts, together with explanations, that you can share with your colleagues for set purposes such as reports on regulatory compliance, graphs relating to a specific trial or for easily generating regular standardised reports.
Add charts
Simple drag and drop interface to build reports from existing presets.
Add context
Insert static text and headers to give your report structure and explain charts.
Adjust date range
Charts are dynamic and the date range can be adjusted across the whole report. Perfect for updating monthly or annual reports.
Sharing your report
Reports can be shared within an organisation or kept private to just the user who created it.

Reports are built using a drag and drop interface that allows you to simply drop in presets you've already saved in SamKnows One.
Agent administration
In SamKnows One you are able to view and manage individual test agents from within agent administration. This will let you view useful environmental information, debugging information and allow you to manage metadata of these measurement agents, allowing users to be self-sufficient.
Manage your test agents
Activate or deactivate the test agents on your panel. Modify the metadata assigned to each test agent. View recent threshold breaches.
Add metadata fields
These extra fields allow you to split, filter, and aggregate when viewing analytics.
Adjust test schedules
You can create multiple test schedules and assign different agents to different schedules.

View useful environmental information for each of your test agents.
Account management
In SamKnows One we provide a management interface that allows you to view and manage all of your subscriptions to various products across the SamKnows ecosystem. This gives you an at-a-glance view of what you can use, as well as other products available to purchase that you may also wish to use.
Data subscriptions
Manage the data panels you can see.
Product subscription
Manage the features and products you can use.
Router Agent licenses
Purchase additional licenses to activate the Router Agent on your CPE.
Your organisation
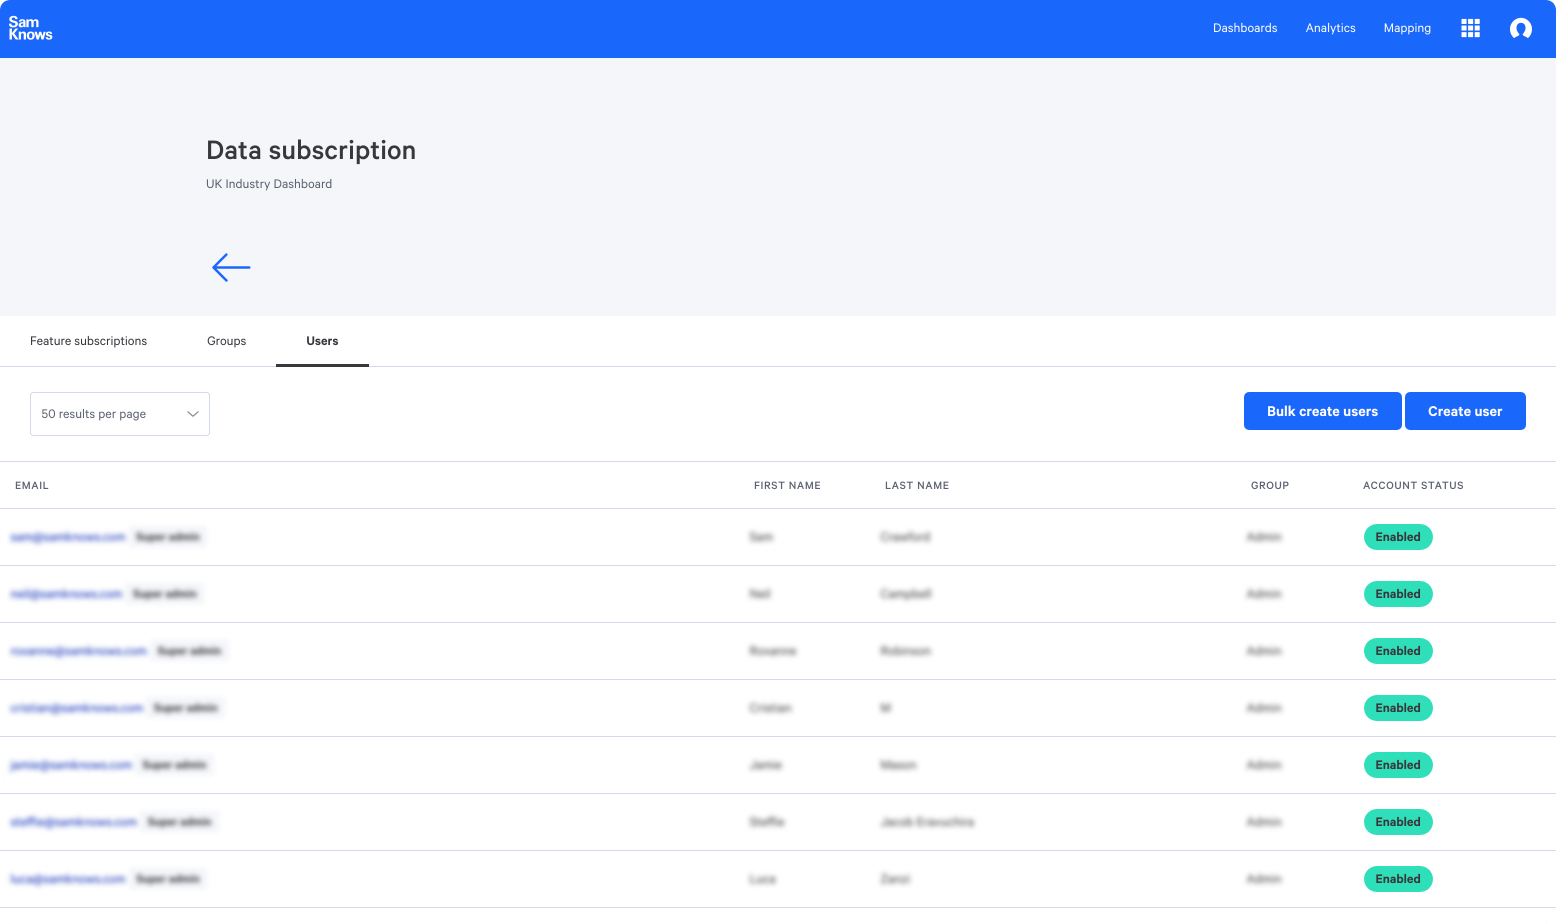
Create and manage users, add them to groups and restrict permissions based on products.

Administrate who has access to SamKnows One and what features they can use. Create groups for commonly used permissions such as customer care agents.


